Water resources of Orissa
WATER MANAGEMENT April 10th. 2008, 11:39amFollowing is from http://teamorissa.org/water.asp.
Water Resources: India & Orissa (Unit in BCM)
|
Description
|
India
|
Orissa
|
|
Annual Precipitation |
4000
|
230.76
|
|
Average Annual Water Resources |
1869
|
141.408*
|
|
Utilizable Water Resources (Surface & Ground) |
1122
|
108.147
|
|
Utilizable Resources (% of precipitation) |
28%
|
47%
|
* include trans-boundary flow
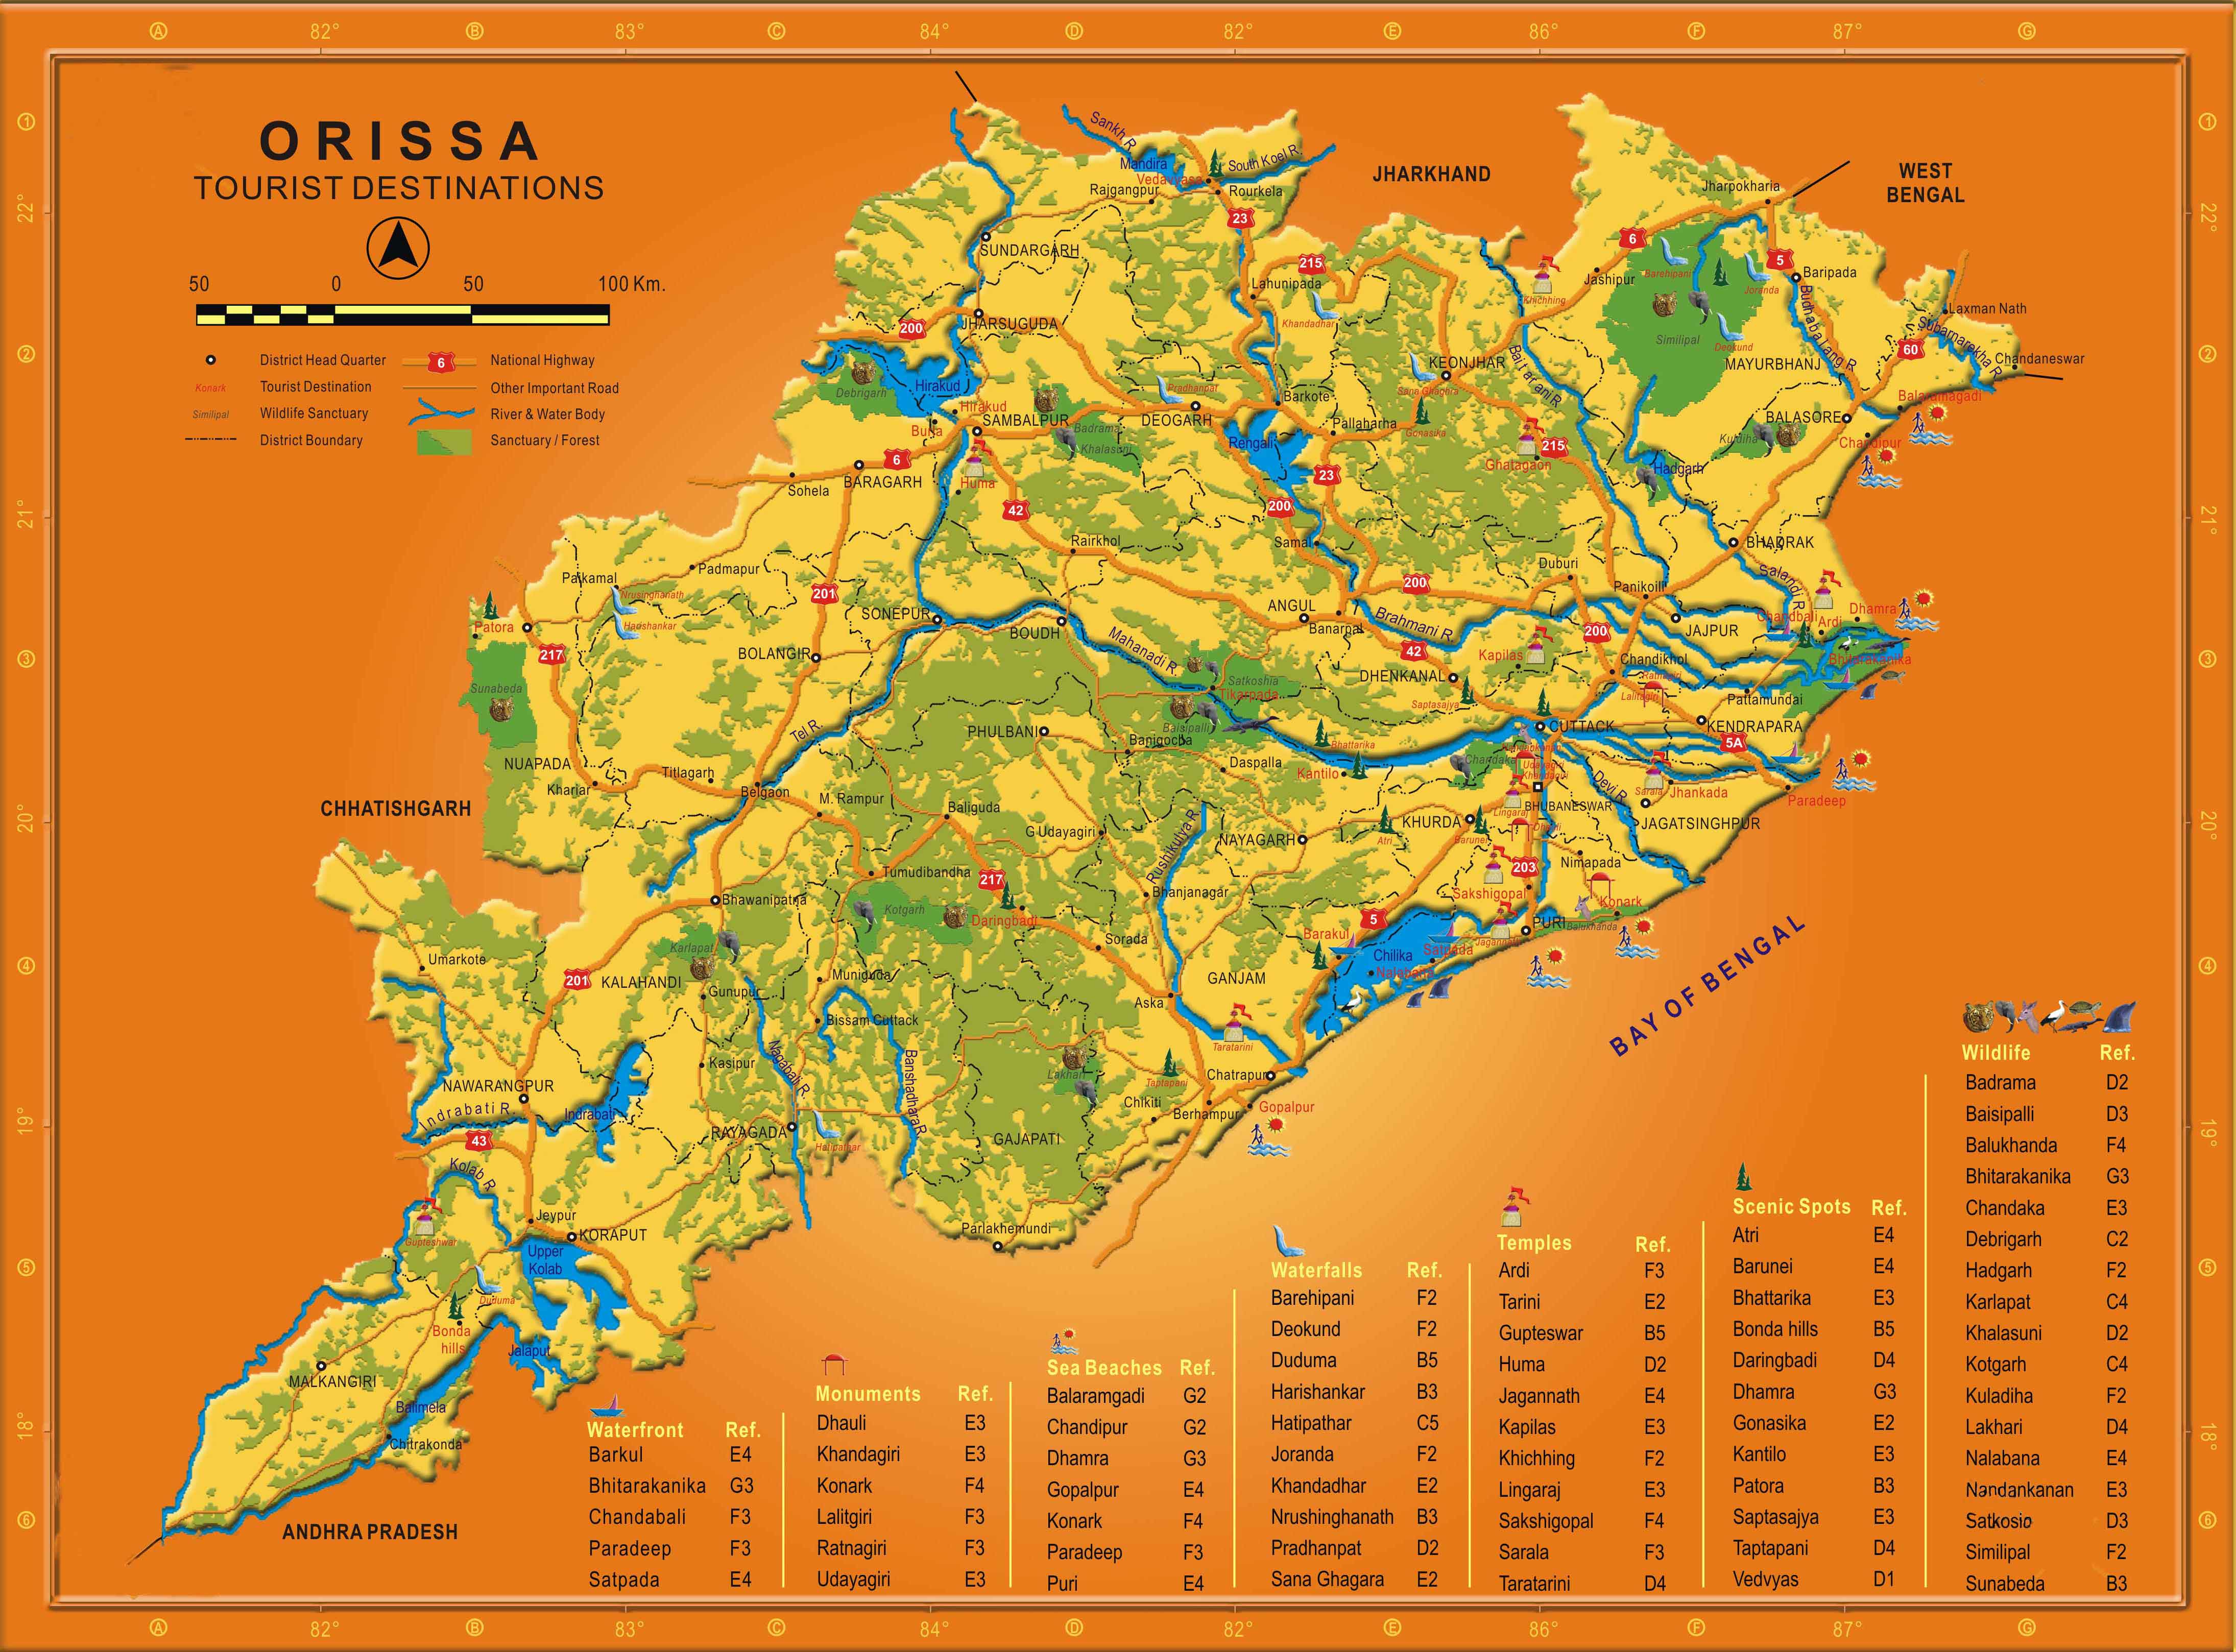
The State is blessed with an extensive network of rivers & streams. As per assessment made in 2001, the average annual availability of surface water resources is about 120.397 BCM. Out of the above, the yield from its own drainage boundary is 82.841 BCM and inflow from neighboring states through interstate rivers is 37.556 BCM. Considering the topography and geological limitations, 75% of the average annual flow can be utilized. Due to increasing demands for water for various uses, an attempt has been made to assess the availability of Water Resources by the year 2051. The assessment reveals that the surface water availability from its own drainage boundary remains more or less fixed but the inflow of surface water from neighboring states will be reduced from 37.556 BCM to 25.272 BCM. The following table shows the assessed inflow of surface water pertaining to the years 2001 and 2051.
Assessed Inflow of Surface Water Scenario: 2001
|
Basin Name
|
Average Annual flow (BCM)
|
75% dependable flow (BCM)
|
|||||||
|
Own
|
Outside State |
Total
|
Own
|
Outside State |
Total
|
||||
|
Mahanadi
|
29.90
|
29.255
|
59.155
|
25.508
|
23.225
|
48.732
|
|||
|
Brahmani
|
11.391
|
7.186
|
18.577
|
8.849
|
5.521
|
14.011
|
|||
|
Baitarani
|
7.568
|
–
|
7.568
|
5.434
|
–
|
5.434
|
|||
|
Rushikulya
|
3.949
|
–
|
3.949
|
2.782
|
–
|
2.782
|
|||
|
Vamsadhara
|
5.083
|
–
|
5.083
|
3.881
|
–
|
3.881
|
|||
|
Budhabalanga
|
3.111
|
–
|
3.111
|
2.521
|
–
|
2.521
|
|||
|
Kolab
|
11.089
|
–
|
11.089
|
8.885
|
–
|
8.885
|
|||
|
Indravati
|
6.265
|
–
|
6.265
|
4.451
|
–
|
4.451
|
|||
|
Bahuda
|
0.438
|
–
|
0.438
|
0.213
|
–
|
0.213
|
|||
|
Nagavali
|
2.853
|
–
|
2.853
|
2.322
|
–
|
2.322
|
|||
|
Subernarekha
|
1.193
|
1.115
|
2.308
|
1.193
|
1.115
|
2.308
|
|||
|
Total
|
82.841
|
37.556
|
120.397
|
65.679
|
29.861
|
95.540
|
|||
|
Basin Name
|
Average Annual flow (BCM)
|
75% dependable flow (BCM)
|
|||||||
|
Own
|
Outside State |
Total
|
Own
|
Outside State |
Total
|
||||
|
Mahanadi
|
29.90
|
21.039
|
50.939
|
25.508
|
16.702
|
42.210
|
|||
|
Brahmani
|
11.391
|
3.118
|
14.509
|
8.849
|
2.395
|
10.884
|
|||
|
Baitarani
|
7.568
|
–
|
7.568
|
5.434
|
–
|
5.434
|
|||
|
Rushikulya
|
3.949
|
–
|
3.949
|
2.782
|
–
|
2.782
|
|||
|
Vamsadhara
|
5.083
|
–
|
5.083
|
3.881
|
–
|
3.881
|
|||
|
Budhabalanga
|
3.111
|
–
|
3.111
|
2.521
|
–
|
2.521
|
|||
|
Kolab
|
11.089
|
–
|
11.089
|
8.885
|
–
|
8.885
|
|||
|
Indravati
|
6.265
|
–
|
6.265
|
4.451
|
–
|
4.451
|
|||
|
Bahuda
|
0.438
|
–
|
0.438
|
0.213
|
–
|
0.213
|
|||
|
Nagavali
|
2.853
|
–
|
2.853
|
2.322
|
–
|
2.322
|
|||
|
Subernarekha
|
1.193
|
1.115
|
2.308
|
1.193
|
1.115
|
2.308
|
|||
|
Total
|
82.841
|
25.272
|
108.113
|
65.679
|
20.212
|
85.891
|
|||
Ground Water Resources:
The natural recharge of ground water takes place through percolation from land after rain events. The quantum of dynamic ground water, which can be annually extracted, is generally reckoned as ground water potential. As per assessment made in 2001, the total annual replenishable ground water resource of the state is 21.011 BCM, out of which 60% i,e 12.607 BCM is safe and usable.
Per-capita Water Availability:
The
The per-capita water availability is reducing progressively owing to increase in population. In 2001, the average per-capita water availability (both surface and ground) in the state was around 3359 cubic meter (cum) per year, as compared to the national average of 1820 cum. With the projected future population the per-capita water availability in the state will reduce to 2218 cum in 2051. Per-capita water availability less than 1700 cum is termed water stress condition while if it falls below 1000 cum, it is termed as water scarce condition. Though per-capita availability of water resources in our state is relatively favorable in the aggregate, the Rushikulya basin will experience a scarcity condition and basins like Budhabalanga and Bahuda will be close to scarcity condition by 2051.
Water has always played an important role in providing livelihood, hygiene and environmental securities since the dawn of civilization. The demand pattern is changing rapidly with increase in population, urbanization and rapid industrialization. Keeping in view the constraints of water availability and the variety of its uses, water allocation issues need to be addressed in a wise manner. Considering this, the present and future requirement of water for all purposes have been assessed, which is given in the table below.
Water requirements for different uses ( Qty. in BCM)
|
Uses
|
Year-2001
|
Year-2051
|
|||||||
|
Surface
|
Ground
|
Total
|
Surface
|
Ground
|
Total
|
||||
|
Domestic
|
0.798
|
1.198
|
1.996
|
1.202
|
1.803
|
3.006
|
|||
|
Agriculture
|
18.00
|
4.688
|
22.688
|
40.00
|
9.408
|
49.408
|
|||
|
Industry
|
0.606
|
0.100
|
0.706
|
1.750
|
0.20
|
1.950
|
|||
|
Environment
|
21.00
|
8.40
|
29.40
|
21.00
|
8.40
|
29.40
|
|||
|
Others
|
0.10
|
0.10
|
0.200
|
0.20
|
0.20
|
0.40
|
|||
|
Total
|
40.504
|
14.486
|
54.99
|
64.152
|
20.01
|
84.463
|
|||
Water Storage:
A storage capacity of 17.00 BCM has so far been developed through completed major, medium and minor(flow) projects. Besides, the projects under construction will contribute to an additional 1.47 BCM. The details are given in the following table.
Reservoir Storage Status as on 31.03.2007 ( Qty. in BCM)
|
Category
|
Completed Projects
|
Ongoing Projects |
||||
|
No
|
Capacity
|
No
|
Capacity
|
|||
|
Major
|
7
|
14.86
|
4
|
1.04
|
||
|
Medium
|
38
|
1.30
|
9
|
0.43
|
||
|
Minor
|
2340
|
0.85
|
–
|
–
|
||
|
Total
|
2385
|
17.01
|
13
|
1.47
|
||


.jpg)