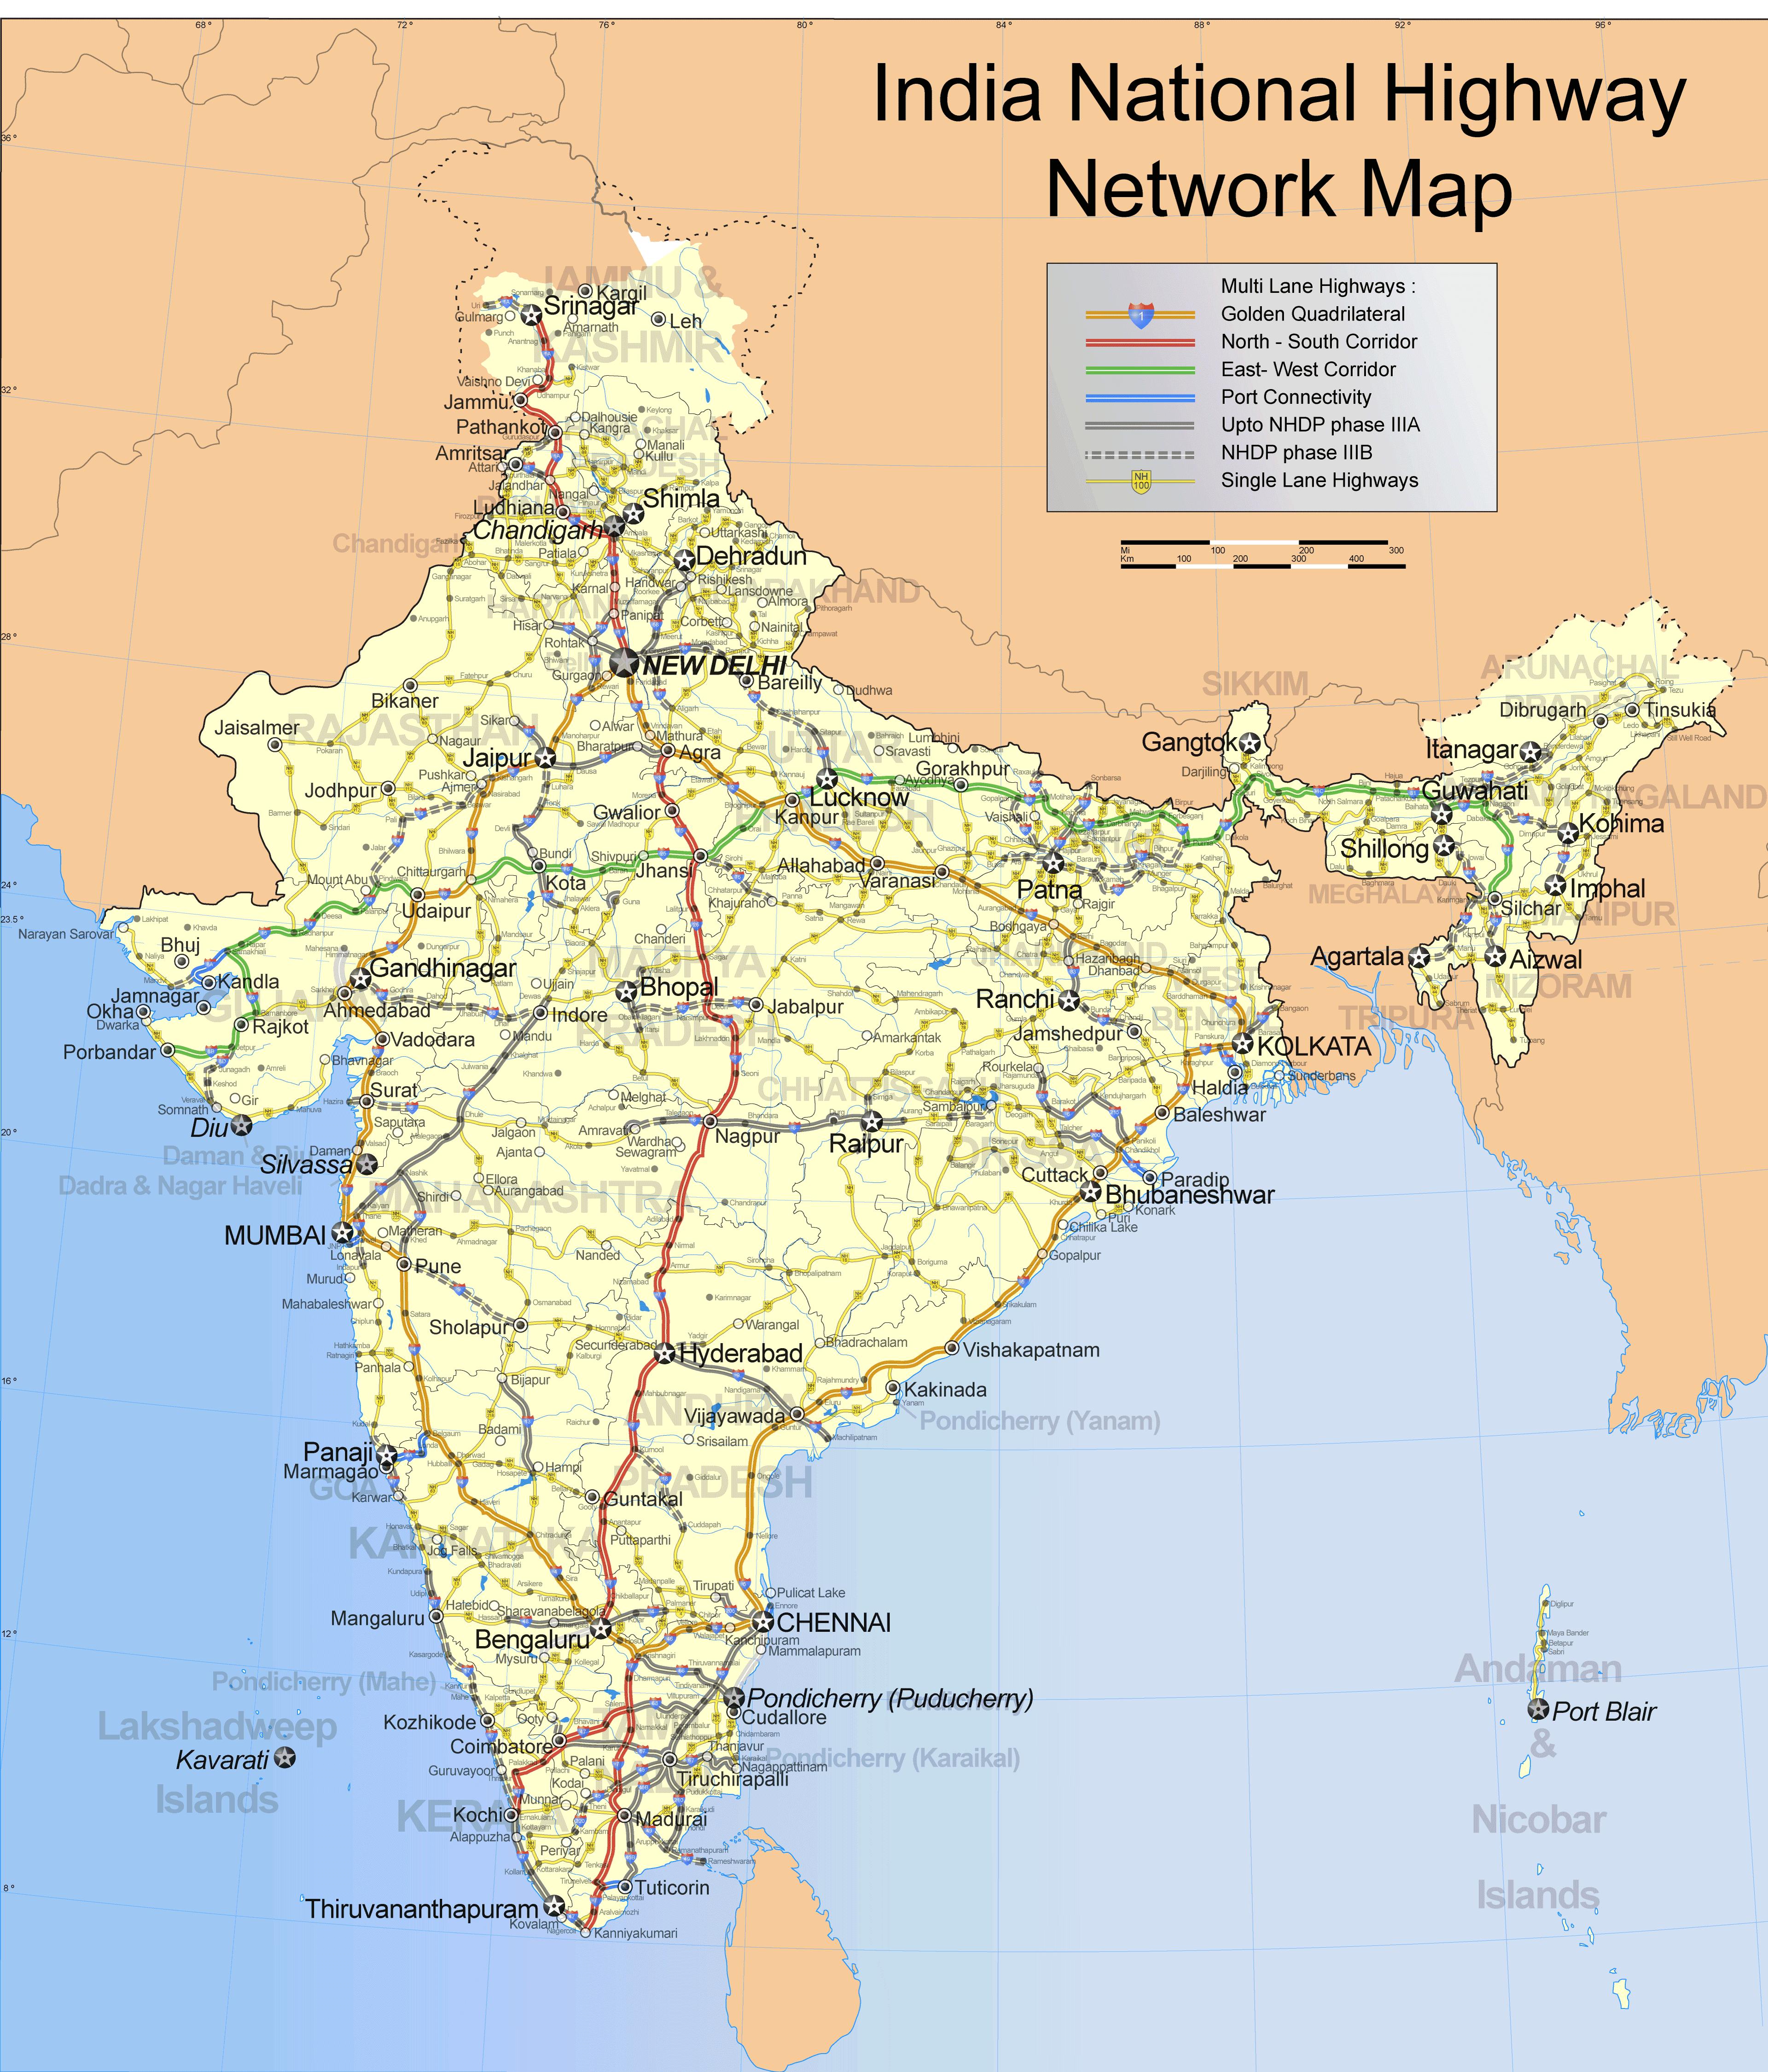
State wise per capita power consumption in India
CENTER & ODISHA, POWER: generation, distribution, and management August 20th. 2007, 1:31pmFrom a PIB. (In general, the more the power consumption, the more developed a state/country is and the more industrialized the state/country is. With the conservation movement, this may change though. )
STATEWISE GROSS ANNUAL PER CAPITA CONSUMPTION OF ELECTRICITY DURING THE YEAR 2005-06 (UTILITIES & NON-UTILITIES)
Name of the
Per Capita Consumption*
State /U.T.s
of Electricity (kWh)
Haryana
1090.39
Himachal Pradesh
765.86
Jammu & Kashmir
711.01
Punjab
1436.79
Rajasthan
572.20
Uttar Pradesh
311.82
Uttarakhand
654.84
Chandigarh
1553.96
Delhi
1766.94
Sub-Total(NR)
602.56
Gujarat
1283.77
Madhya Pradesh
580.34
Chhattisgarh
685.81
Maharashtra
934.43
Goa
1970.08
Daman & Diu
8300.12
D. & N Haveli
11567.67
Sub-Total(WR)
916.28
Andhra Pradesh
723.10
Karnataka
720.43
Kerala
424.13
Tamil Nadu
976.81
Lakshadweep
368.29
Pondicherry
2509.25
Sub-Total(SR)
757.79
Bihar
85.86
Jharkhand
548.74
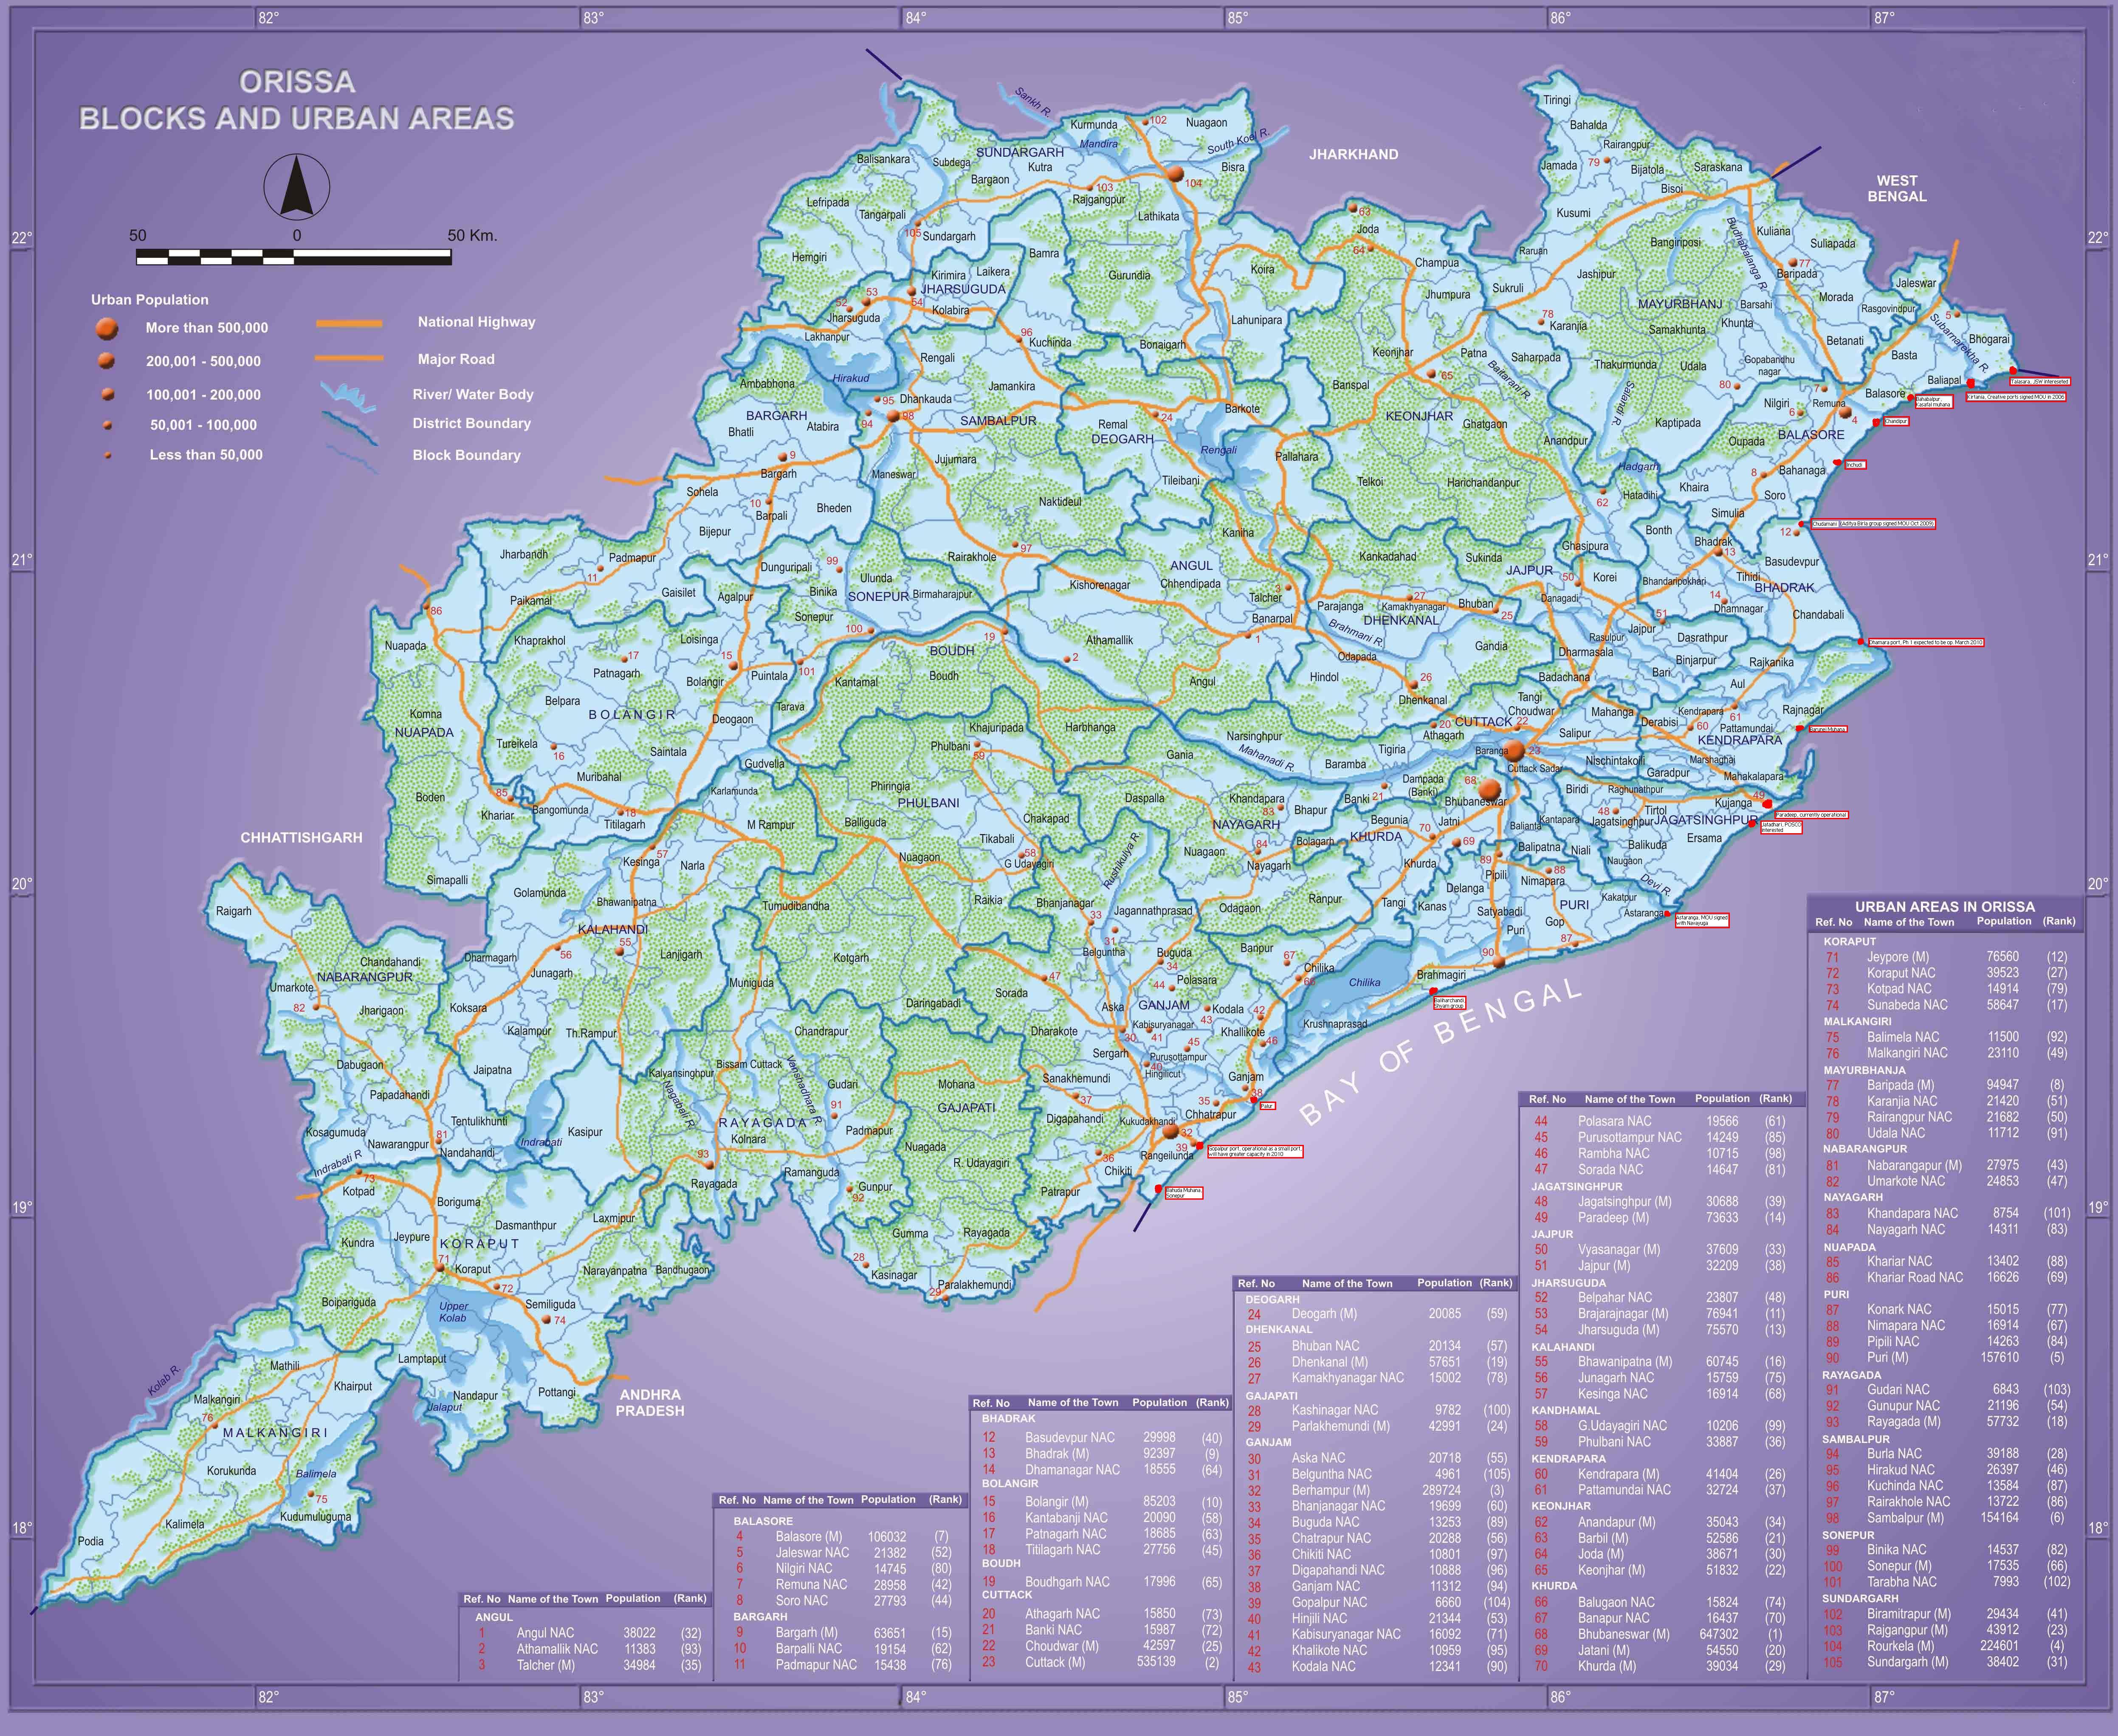
Orissa
633.93
West Bengal
380.61
A.& N. Islands
407.77
Sikkim
429.81
Sub-Total(ER)
332.21
Assam
170.65
Manipur
215.21
Meghalaya
517.54
Nagaland
179.34
Tripura
190.62
Arunachal Pradesh
297.66
Mizoram
250.15
Sub-Total(NER)
201.44
Total (All India)
631.41
Note : * As per UN methodology :Per Capita Consumption equal to gross
The per capita consumption of electricity in some developed countries as calculated by the International Energy Agency for the year 2004 is as given below:
|
Sl. No. |
Name of the Country |
Per Capita Consumption (kWh) |
|
|
||
|
1 |
Canada |
17179 |
|
2 |
USA |
13338 |
|
3 |
Australia |
11126 |
|
4 |
Japan |
8076 |
|
5 |
France |
7689 |
|
6 |
Germany |
7030 |
|
7 |
United Kingdom |
6206 |
|
8 |
Russia |
5642 |
|
9 |
Italy |
5644 |
Source: International Energy Agency publication “ Key word Energy Statistics, 2006”.


.jpg)